Tuesday, January 17, 2017

Guest Blogger Stephan Sloan: Sick Sigma?

For the Reverse Auction portion of Stage 4 there has been a reassuringly green box and check mark around the First Component of the Final Stage Rule graphic on the Incentive Auction Dashboard. https://auctiondata.fcc.gov/public/projects/1000However, we can learn that the First Component is in fact not met as noted in paragraph 22 of https://apps.fcc.gov/edocs_public/attachmatch/DA-16-1354A1.pdf released back on December 9th. (Thank you again to @Nancy_Drew for this.)

The requirement of the First Condition of the Final Stage Rule is now that there be “market pricing” defined by the FCC as greater than $1.25/MHz/Pop for the top 40 PEAs. If I add up all the bid prices, divide by 10 (MHz) and divide by pops bid for the top 40 markets at the open of Stage 4 I find an average of $1.29. However, that’s not the way it’s done. The equation below is my translation of the FCC formula for calculating the average price:


Calculating in this manner, specifically differentiating between the sale of blocks with demand and those supplied seems to cause the Final Stage Rule to seek a market price for both the blocks sold and those unsold. I would not have anticipated unsubscribed blocks in the top 40 PEAs and yet that is the case in both Los Angeles and San Diego. Carrying the weight of those goose eggs in the equation is heavy. These un-bid blocks represent perhaps the simplest and I believe the most efficient way to satisfy the First Condition of the Final Stage Rule. Bids for an additional block at present pricing in both Los Angeles and San Diego would cost $441,486,000 and require a bidder or bidders with 23,300 available bidding units. Both of these requirements are less than the amounts eliminated in the New York PEA by the progression from Stage 3 to Stage 4. The resulting average of $1.2533…. overshoots the rule. Alternatively, without further demand in Los Angeles and San Diego, if pricing were to advance to the Clock Price in each of New York, Chicago, San Francisco, Baltimore, Philadelphia, Boston, Dallas and Miami it would cost bidders $400,905,540 to achieve $1.2501… While this path costs fewer dollars it also represents two fewer blocks of spectrum licensed and therefore, I believe, is less efficient.

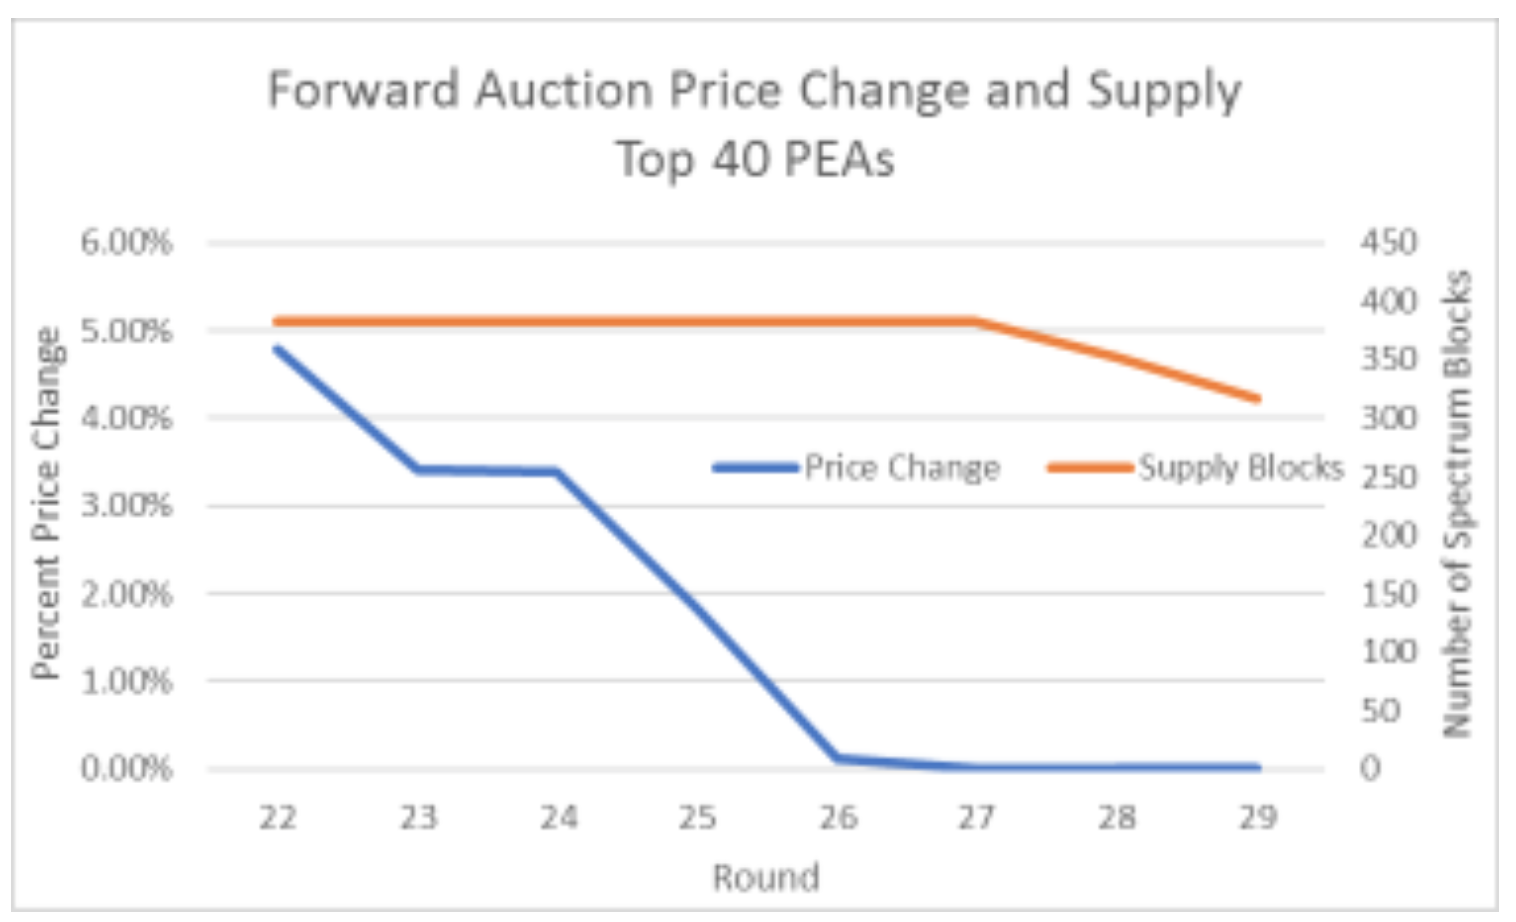
I have confidence the spectrum offered in the Forward Auction is very valuable and the current Incentive Auction process is not establishing its market value but instead answering the question at what price will the previously approved bidders accept this amount of spectrum reallocated from broadcast to broadband use. The data for supply and price thus far I believe supports this. The following chart presents the progression in pricing (I continued the Stage 1 round count through successive Stages for the x-axis) along with the number of blocks of spectrum supplied.


The rapid progression of Stages has clearly illustrated how compressible demand is for blocks in the top 40 PEAs. As supply is removed from all PEAs, demand has dropped nearly in step. This is reflected in the following chart presenting aggregate supply and aggregate demand in blocks for each stage. (I have focused my analysis on C1 or unimpaired blocks.)


Demand in markets smaller than the top 40 has percolated up marginally.


I keep in mind that 75% of all demand units in the Forward Auction are represented in the top 40 PEAs. This analysis also seems to put lie to any claim that there is a pool of demand displaced from the top 40 PEAs by the recent Stage progressions that is loitering outside the top 40 PEAs causing the auction to advance but waiting for some as of yet unoccasioned event to reintroduce itself and drive pricing up in the top markets.

Demand has deserted the Forward Auction almost as quickly as the FCC has constrained supply. The theory of displaced demand in larger or different PEAs reintroducing itself to accept supply or push pricing on other/smaller PEAs I have not found supported in the data. Perhaps this auction has been long enough and this winter has been cold enough that some of the demand from the Northeast will find its way to lovely Southern California and one of those unsubscribed LA and San Diego blocks.

Paragraph 22 of the Public Notice I cited at the start concludes with, “…approximately three cents short of the required $1.25 benchmark.”. This is perfect Incentive Auction prose as there is a footnote indicating, “The auction system neither rounds nor truncates the average price when determining whether the first component of the final stage rule has been met.” Three cents are, in fact, the path to Stage 5. I believe $441,846,000 or even a little less can get it done now.

401.454.3130


Thursday, January 12, 2017

Guest Blogger Stephan Sloan: One Round with the Champ


When the results of Stage 2 were published, I was considering the probability of validating the Incentive Auction if the Forward Auction continued to fail at advancing the Auction Proceeds. The chart above indicates the outcomes of some models I was considering. The outcome of Stage 3 validated these models and increased my interest in their Stage 4 prediction. Perhaps only in a federal US government adventure can a $4 Billion spread (implied in Stage 4 data above) appear as tantalizingly close.

Throughout the Incentive Auction process, I believe reserve prices have been a moving target. For many, calculation of reserve prices rose as the prospect of being frozen in the auction became more real and proximate in their minds. For the first two Stages the perception of the expense of winding down their business or porting it to another channel grew. The measured but significant increase in Stage 3 Reverse Auction competition may have added the concept of relative reserve price to the mix. Concerns of underestimating the expense of winning (freezing) gave way to assessment of the probability of winning.


Stage 4 surely has added to the strain of reserve price discipline for station owners with the model no-longer finding any support from scarcity of participation and seeking the exit of multiple participants in many markets. It is this strain that is causing me to discount the previously reliable model charted above and consider the possibility of starting the Stage 4 Forward Auction with the Final Stage Rule met.


Reserve price discipline may be the greatest test of the Reverse Auction. Without respect to the thoughtfulness or conviction with which one may arrive at a reserve price actually sticking to it is another matter. At the peak of his career, Mike Tyson was apprised by a reporter that his next opponent had a plan to defeat the champ. Tyson’s reply echoed Joe Louis’s answer to a similar question a generation before when he quipped, “Everybody’ has a plan until they get punched in the mouth.” For many station owners, whose experience in Stages 1-3 was one of delight with the outcome, the approximation and arrival at their anticipated reserve price over the past few days has no doubt been as unpleasant as a punch in the mouth.


There is genius too in the design of the Reverse Auction as bidders are provided a Vacancy Index which is quite good for the pinning of hopes if not otherwise useless for a single station owner. The transition to 1% decrements and the option to accept a “free” VHF station further the virtual suction down the rounds. These elements introduce quicksand on what looked like firm ground from round 10 of the Stage.


This sentiment is compelling me towards expecting an end of the auction at Stage 4.


Note: I made an incorrect statement about the Final Stage Rule in an earlier version of this post. I removed the mistake from this version and am working to understand a recent FCC post.


If a silver lining can be found for the decrease in station pricing to achieve validation at Stage 4 it is a less is more argument. Lower pricing in this Stage permits the model to include more stations (by not progressing to an additional Stage). I believe a progression from Stage 4 to 5 of the Reverse Auction represents nearly a fully reserve price supported model and accordingly further reductions in clearing costs are mostly accomplished by taking fewer stations and not decrementing the prices of the stations bidding. The chart below presents data for models estimating the number of stations frozen in the auction. The number indicates the average number of stations frozen in the models I chose and the size of the bubble represents the variance among the models.


We will very shortly know exactly how many stations are frozen and the aggregate value of those stations. As always, I look forward to your comments and the opportunity to discuss these observations.


Stephan Sloan
Director, Media Services Group
401.454.3130
ss@mediaservicesgroup.com